Data vis with d3 + react: State and lifecycle

State + Lifecycle management
The UI for Uptime is built using React + D3.
This requires some interesting state/lifecycle management, due to both frameworks taking ownership of the DOM nodes that they create in terms of creation/update/destruction cycle.
The basic strategy here is for React to handle most data transformation, storage and app state management, and have d3 hooked up to the React componentDidUpdate life cycle event so that it re-draws your graph upon state/prop changes in your React graph component, rather than the traditional d3 usage in which the graph lifecycle is managed within the d3 javascript that you write.
This means that things like click/hover events etc on your d3 nodes should be handled by calling React lifecycle events, updating state which then flows back down into the d3 graph.
This is great for interactions between multiple graphs or between graphs and other UI components, ie. toggling on or off d3 data layers via a non-d3 legend etc, or otherwise customising your graph by a config object stored in the app state and manipulated by any number of other UI interactions.
Usage in Uptime
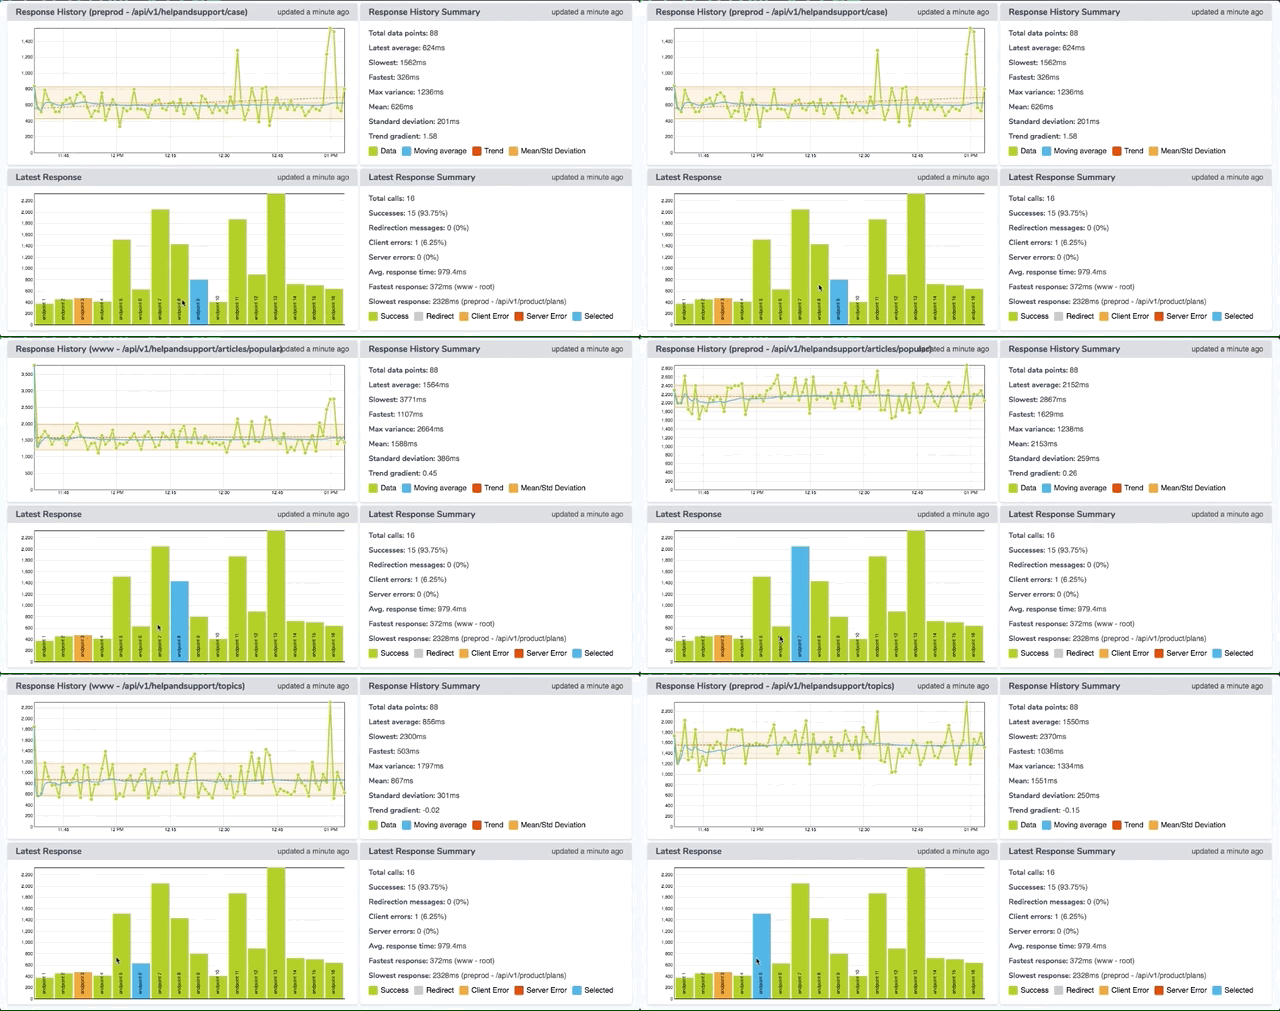
Using d3 click events to update app state rather than to trigger other d3 updates, we can update multiple components around our dashboard by interacting with our graphs.
In uptime, this technique is used to select an endpoint in the latest response graph that you would like to view the history for. This changes the app state, which flows down into the response history graph, so that the user can see the historical data of their chosen endpoint, and into the UI panel for the historical data summary.

Users can also toggle data layers on the history graph by clicking non-d3 elements in the history summary panel, which again updates app state and flows down into the history graph, triggering a re-draw of the graph due to a change in the config object passed to the graph.
